When writing Exotic Picks, I wanted to be able to test the base rates of various draft pick trade concepts in code. The first task would be to figure out how to value and implement a draft trade asset programmatically. This post describes my approach and some of my learnings from this exercise.
Standing Trajectories
At its core, a draft asset trade is a bet on the future performance of a team, and by consequence where a draft pick potentially several years into the future will land. To make such a prediction requires a model of how a team's performance will change over time. In particular we need to know the distribution of a team's performance in future years, not just the average. Averages are misleading in a draft context where the distribution of player impact is highly skewed. For example, knowing that a team will average the 15th best record in the league could mean that they land the 15th every year or that half the time they land 1st and half the time they land 29th, the latter being far more valuable from a draft pick value perspective.
The simplest way to predict the distribution of how a team will perform in year t + 1 is to use their standing in year t. Under the umbrella of simplicity here we can use the most naive approach of all: assume the distribution of a team's standing in year t + 1 is equal to the empirical distribution of how all teams with the same standing in year t have historically performed. For instance, the empirical distributions for standings in year t + 1 of teams with standings 3 and 27 in year t over the last 184 years looks like:

This gives a decent starting point but it's fairly clearly that this doesn't reflect the true probability distribution of what the standings for year t+1 should look like. For starters, every standing is possible in year t+1, but the empirical distribution has a lot of 0 probability mass for certain standings. Further, small sample size gives couterintuitive implications here, for example it's pretty unlikely that the #3 team has a 5.5% chance of being the worst team in the league the following year but we only have 18 data points and it's happened once (shout-out 2019->2020 Warriors).
One way to smooth this probability distribution is to use the outcome of neighboring standings to inform the outcome of a particular standing. For example, it's pretty likely that the empirical distribution of standings for teams with standings 2 and 4 in year t will be pretty informative of how standing 3 will turn out, but less likely that standing 15 is informative. We incorporate a decay factor of 0.75 to model this likelihood: that is, we weight the empirical distribution of standings for teams with standings 2 and 4 in year t by 0.7 and the empirical distribution of standings for teams with standings 1 and 5 in year t by 0.7^2 and so on. This gives us a smoothed probability distribution of standings for year t+1 that looks like:

We can apply a similar process to projecting multiple years out, smoothing out the empirical distribution of standings multiple years out.

Note that this distribution is less skewed than the next year distribution - intuitively a team is more likely to perform similarly next year than 2 years out.
From a distribution of standings we can then directly calculate the odds of landing each particular draft pick from the NBA lottery gods.6
Of note, the distributions are still randomly spiky at certain draft standings. In retrospect I probably should've used a bucketing approach8 then sampled from each bucket but this is a good enough approximation for now.
Draft Pick Value
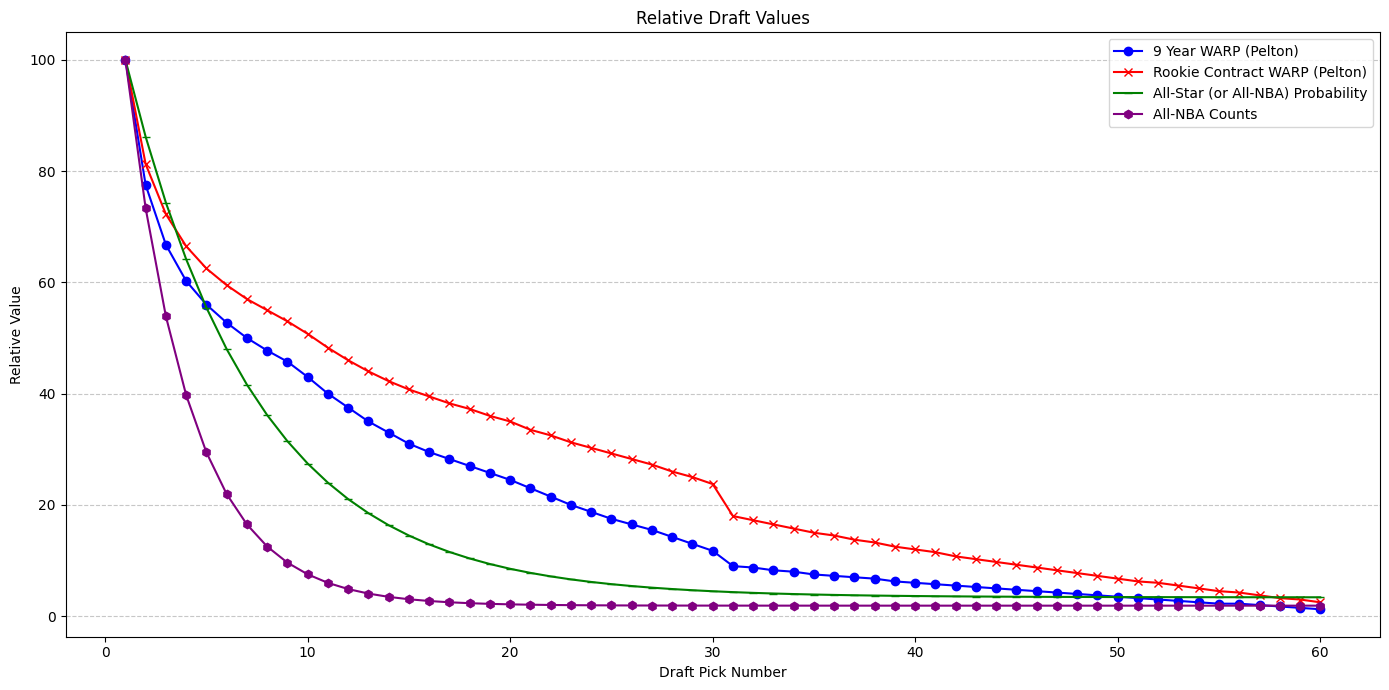
There have been many attempts to estimate the relative value of a draft pick at particular slots, so this won't be the focus of this piece. In fact, differences in opinion and valuation based on what stage a team is in are a big part of the reason trades involving draft picks exist. Instead, I use the following rough estimates:
- Surplus value across rookie contract (Pelton) - how much a player outperforms their contract during the rookie contract
- Surplus value across first 9 years (Pelton) - how much a player outperforms their contract during the first 9 years of their career
- Star Probability - whether a player makes at least 1 All-Star or All-NBA team in his career
- All-NBA Counts - how many times a player makes an All-NBA team
Note that the more star and upside focused we get, the more skewed the distribution of player value becomes. For example, the surplus value of the #1 pick across the rookie contract is roughly 2x the surplus value of the #2 pick, but the all-NBA equity of the #1 pick is roughly 10x that of the #10 pick.

Defining a Draft Pick Asset Class
What makes this a bit tricky to implement this programmatically is that a draft asset is different from a single draft pick in that an asset can be a function over several picks, and can turn into other assets conditional on conveyance or the lack thereof. For example, a pick can be top-3 protected in 2022, top-1 protected in 2023, and unprotected in 2024. Similarly, an asset can be the most favorable of 2 picks in a given year (via a swap).
We define a draft pick as:
@dataclass
class DraftPick:
    team: str # Team abbreviation
    year: int # The year the draft pick would be be conveyed
    round_number: int # 1 or 2 for first or second round
    protection_numbers: list # List of pick numbers that are protected
    is_deferrable: bool # Whether a pick is deferrable or not
To turn this into an asset:
- The list of picks that could be in play
- A function that specifies which of these picks gets conveyed. For instance,
MOST_FAVORABLEwould return the pick with the highest number (as would be the case in the right to swap), andALLwould return all of the picks.
class AggregatorFunction(Enum):
    MOST_FAVORABLE = "MOST_FAVORABLE"
    LEAST_FAVORABLE = "LEAST_FAVORABLE"
    ALL = "ALL"

# one single draft pick bundle is a set of draft picks for a given year
class DraftPickBundle:
    def __init__(
        self,
        draft_picks: List[DraftPick],
        draft_pick_aggregator_function: AggregatorFunction,
        recipient_team: str=None,
    ):
        self.year = min([draft_pick.year for draft_pick in draft_picks])
        self.draft_picks = draft_picks
        self.draft_pick_aggregator_function = draft_pick_aggregator_function
        self.recipient_team = recipient_team # necessary for Swaps
An asset can then be represented as an ordered list of DraftPickBundle, where if the first bundle is not conveyed, then the next bundle is considered, and so on.
There are still key edge cases of draft assets that this cannot express, for example "first conveyable" picks where a team can convey a pick in the first year they're allowed to under the Stepien rules, but we'll ignore these for now.
Valuing a Draft Asset
Based on the components we've defined above we can now value a draft asset based on the current standings.
- Based on how many years out the earliest conveyable
DraftPickBundleis, we can calculate the probability distribution of what the standings of said team will be at that point in time. From this, we can simulate what the standings will be at that point in time and get a probability distribution of the draft picks by extension. - We can calculate the odds that the pick lands outside of protections (and hence is conveyed), and if so what the expected value of that pick will be.
- If the pick lands inside of protections, we can recursively repeat the process for the next
DraftPickBundlein the asset - that is, simulating the standings for the next year of the draft pick bundle based on the most recently updated standings.
Case Studies
For the following case studies, 100 is the value of the 1st overall pick in a given year. Unless otherwise specified, the value framework we use is Pelton's surplus value of the pick across the first 9 years of the player's career.
The Value of Protection
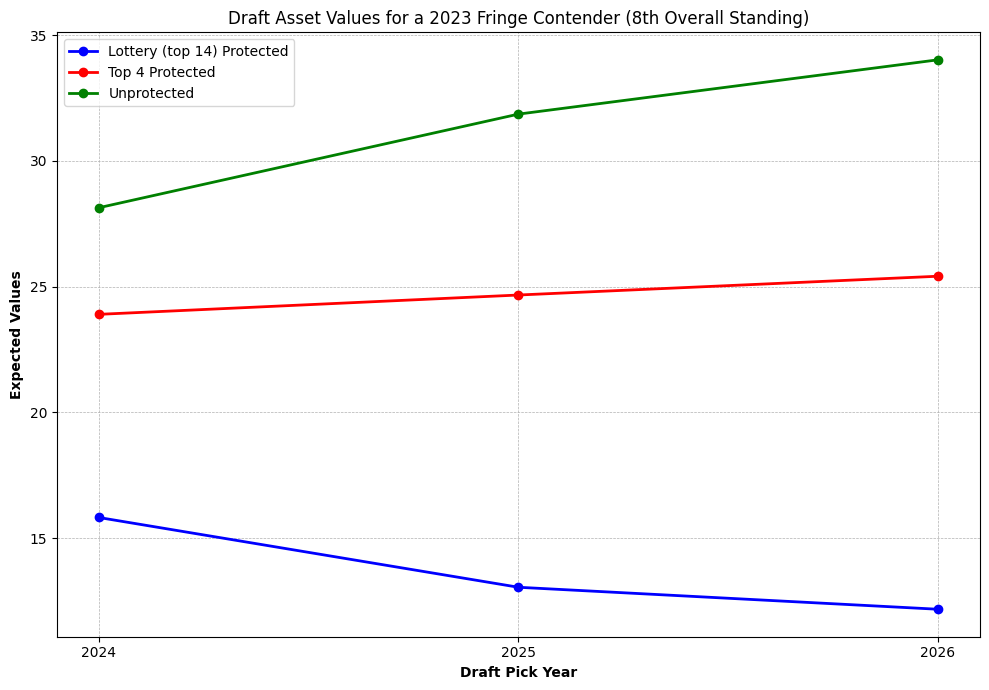
Here we chart out the value of a 3 categories of picks (lottery protected, top 4 protected, unprotected) in the years 2024, 2025, and 2026 for a fringe contender that has the 8th best record in 2023.

We see that protection can dramatically decrease the value of a pick, especially in the case of lottery protection. As expected the value of an unprotected pick goes up the farther out it is for a fringe contender. Interestingly, the value of the pick goes down if it's lottery protected. This is because the odds of the pick being conveyed are lower over time as a current contender is less likely to remain a contender over time, increasing the likelihood that the pick falls within protection and is thus not conveyed.
Reverse Protection
Consider the famous trade that brought Kyle Lowry to the Raptors and a reverse-protected pick back to Houston in 2012 (and eventually got flipped for James Harden). The details of the pick are described as follows7:
The pick was protected if it fell between Nos. 15 and 30 in perpetuity
The pick was protected between No. 1 and No. 3 in 2013; No. 1 and No. 2 in 2014 and 2015 and, if it still had not been conveyed, at No. 1 in 2016 and 2017."
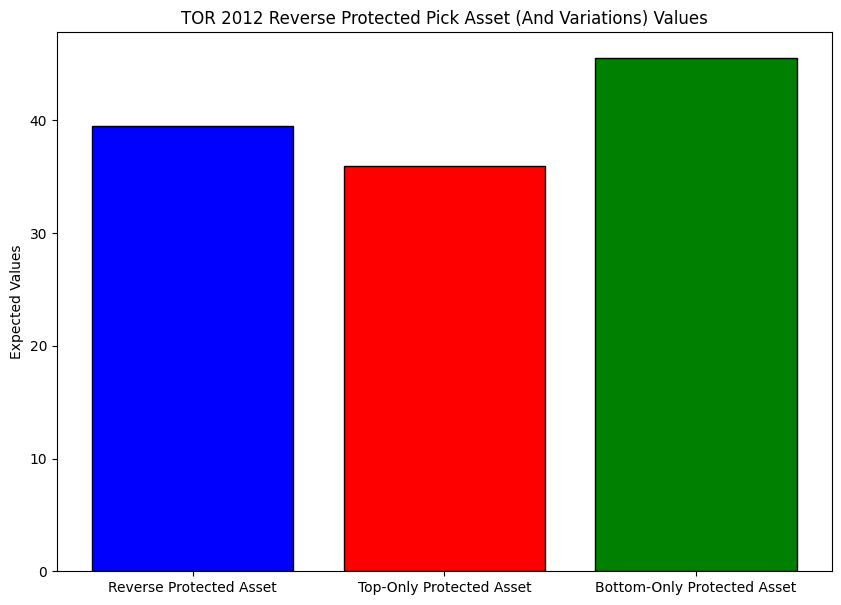
This is referred to as a "reverse-protected" pick because it is lottery guaranteed as opposed to protected. Both the upside and the downside of the pick are protected. To see how this affects the value of the pick, we can compare how the asset would have A) as is, B) without the top pick protections, and C) without the reverse protections.

As by design, the reverse protection makes the pick more valuable than if only the top of the draft was protected. In fact, the impact of the reverse protection by this model is likely understated based on the impact that Lowry could have been expected to have on the Raptors' performance: the Raptors went from 23 wins in 2011-2012 to 34 wins in 2012-2013. This amplifies the importance of the reverse protection given that the better the team the more likely the pick would have fallen later in the following year.
Conclusions and Future Directions
This initial attempt to value draft assets based only on a team's standings at the time of the trade, using smoothed historical trajectories based on how other teams have performed in such a situation and a predefined draft value chart, is inadequate when considering the complexities of team situations. However, I believe that it is useful as a starting point to measure the base rate of where team's end up potentially several years later, and how to think about the value of protection accordingly.
Human or automated changes to the model can be made according to a team's situation. For example, a team in a clear contending window may only value the surplus of the first 2-3 years of draft picks, while a team in a clear rebuilding window may only value the all-star or all-NBA upside of a pick. Some additional areas I'd like to explore:
- How do we improve our estimates of standing trajectories - can we incorporate age of best players, years remaining on contract of best players, or other team characteristics? Can we do this mid-season as well?
- Can we model the impact that draft asset trades have on team behavior, and as a result how it alters the distribution of future standings? For example a team that has given up an unprotected pick in a given year is highly disincentivized to perform near the bottom of standings (even if it doesn't improve the value of their assets to win a few more games). A team that owns all its unprotected picks and has an infusion of young talent is likely to distribute minutes to its young players even at the cost of wins. This is similar to the "Moral Hazard" concept in economics where for example, somebody with insurance may take more risky actions than somebody without.
- How does correlation affect the value of bundles of draft picks? For example, a set of picks and swaps from the same team across a short time window are likely to be highly correlated, while a set of picks from different teams across a long time window are likely to be less correlated. Do we prefer high correlation because conditional on a team being bad at that point in time, the receiving team would be getting a ton of high value picks in succession (à la Nets-Celtics 2013 Trade), or do we want a more "diversified" portfolio of picks?
- What are some ways we can replicate the payoff of draft asset trades without hampering flexibility? See Exotic Picks for a glimpse into some ideas :)
- 2005-2022. 2005 is the year we start from because that's the first year that there's 30 teams in the league↩
- Roughly estimated through cross-validation. This is performed by splitting the 18 years into N=5 folds, training on N-1 folds and maximizing log likelihood across the remaining fold. The decay factor that minimizes the mean squared error of the predictions is
0.7or0.8depending on the run,0.7was chosen because intuitively 2 picks away is weighted half as much as the current pick.↩ - https://www.tankathon.com/pick_odds↩
- For example as in here: https://www.theringer.com/nba/2019/6/27/18760309/nba-title-windows↩
- https://theathletic.com/1341618/2019/11/25/how-the-kyle-lowry-trade-forever-changed-the-toronto-raptors-houston-rockets-and-nba-trades/?source=twittered↩