This has been removed for the time being as I may work on some of these ideas with a basketball team. Please contact me if you'd like to discuss further.
7 posts tagged with "sports"
View All TagsHalf Baked Soccer Ideas
Maximize Table Points, Don't Avoid Losing
A lot of game state inefficiencies in soccer stem from the fact that in league play, a team's objective should be to maximize the expected value of points in the table (where a win is worth +3, draw +1, and loss +0), NOT the probability of not losing.
Strategically this implies that aggression and risk-seeking behavior is +EV. For instance, a common mindset is that team shouldn't commit too many players forward in attack because that risks not having good defensive structure if a team loses the ball. However, these "risky" situations are a good thing in a world where winning is worth 3x drawing. Suppose the score is 0-0 and commiting a few extra players forward increases your chances of scoring a goal by 50% while increasing the chance you concede a goal by 50%. You're currently set to get +1 point from the game because it's a draw. Assuming it's close to the end of the game, committing extra players forward gives EV[Table Points] = 0.5 (+3) + 0.5 (0) = +1.5 points, or adds a whole half point in EV from points on the table, even if this increases your chances of losing the game.
For this reason I think that in neutral situations (or even situations where a team is up a point!) teams should also be more score-first aggressive around substitution strategies, for example by subbing off defenders for attackers. Intuitively in a neutral state long as you're improving your odds of winning by at least half the odds you're increasing your odds of losing, you're coming out ahead by expectation in terms of table points.
Metrics like team xG difference and even more sophisticated player value metrics like VAEP1 which maximize EV[Scoring] - EV[Conceding] likely do not optimize for Table Points correctly. An equivalent increase in scoring and conceding probability is a good thing because it takes away from draw probability and adds winning and losing probability, but would be valued as 0 here.
Note that tournament knockout round football is different - the objective is to maximize the probability of advancing to the next round not EV[Points], so a "draw" state is 50-50, or worth half rather than a third of a win. Conservatism makes a lot more sense there and strategically teams ought to be playing significantly differently than league or group stage play.
Longball Out of Bounds + Press From There
Launching the ball out of bounds to the opponent's touch line and setting up a press from there may be an unaesthetic but highly effective strategy. Read more here: The Longball Out of Bounds (LOB)
"Offensive Rebounding"
Going for "Offensive Rebounds" or crashing the shot after missed shots may be undervalued. Chances in soccer are so hard to come by to begin with, any action to maximize the number of "random" extra chances seems very fruitful to pursue. If a shot is taken and parried into play by the keeper, the defense is likely to be in a more disorganized state than normal run of play, and thus the offense may be able to get a higher than normal chance of scoring from the rebound.
According to John Muller's analysis2, only 3.6% of the Premier League's non-penalty goals come from shot rebounds, but this is "roughly on par with the 4.1 per cent of non-penalty goals scored within two actions after a corner and the 2.9 per cent in the two actions after a free kick." Considering the vast difference between the best set piece teams in Europe and the worst, it seems that this could similarly hold for rebounding.
There is anecdotal evidence of this: in Muller's list of the top 10 rebound shooters since 2013, 3 of them are Liverpool players. The more likely explanatory factor here is that the iconic front 3 of Mane Firmino and Salah played a ton of games together and got a ton of shots off, but eye test suggests that they're crashing from both the wings and the forward spot at a very high rate.
Even ignoring the goals and getting a shot off immediately, recovering the ball near the penalty box from a rebound seems like a good thing.
Move Washed Attackers Back
Anecdotally it seems that on balance attacking players are generally more technically proficient and athletic than players further back. This aligns with the general process of choosing positions at the youth level: the most athletic and talented players are often put at forward, and the less athletic are moved back closer to their own goal.
For example, of the 10 fastest players in the 2023 (defined as top sprint speed), 7 are attackers, 2 are midfielders, and 1 is a defender.
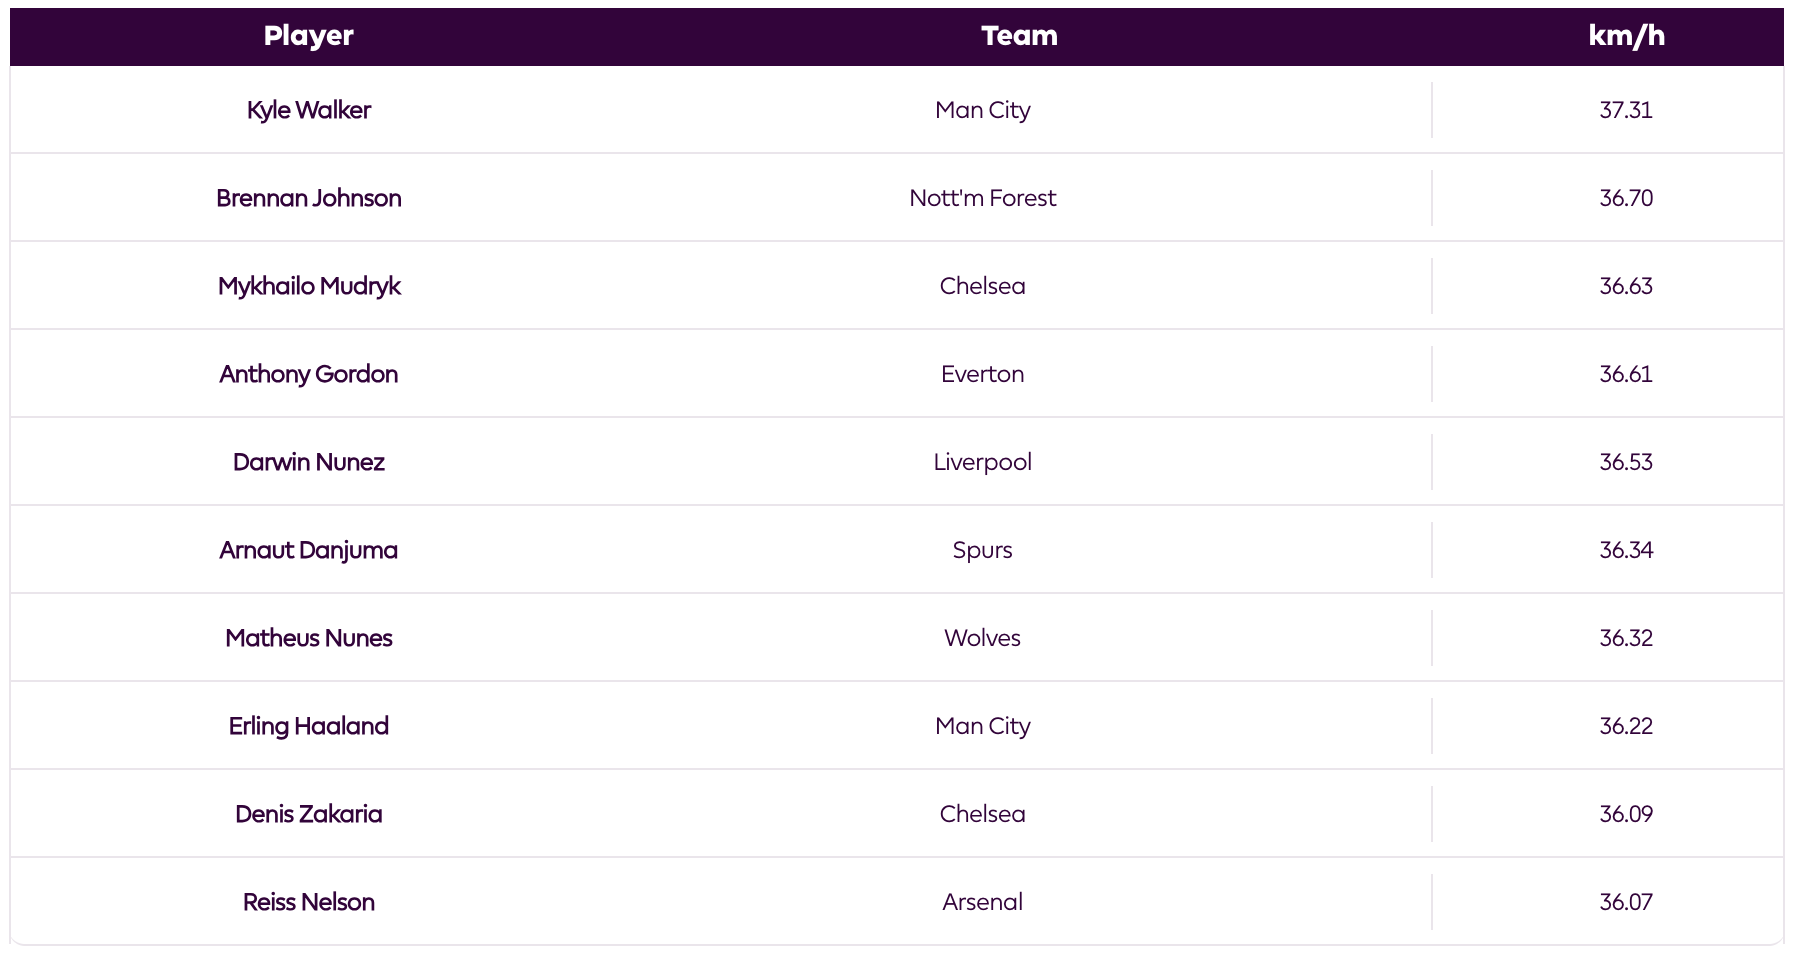
(A confounding factor is certainly that attacking players are more likely to make sprints forward and so more likely to hit their top speeds.)
A guess I have is that attackers who aren't good enough to play in first-team football may be able to play further back in midfield or defense, and some of them might still represent an upgrade over other options at those positions. It'd require retraining offensive habits and learning back-footed defense at a higher level, both way easier said than done; but in a world where we want to be maximizing +3 win probabilities anyways, maybe we want to be more front-footed?
One inspiration here is how in the MLB many shortstops are capable of transitioning to less demanding positions like third base or in the outfield.3
Exotic Picks
“The only thing to bridge the gap [in player value] is draft picks and to me, they’re like cigarettes in prison... That’s the only currency you have. The value changes up and down all the time and it makes for a not very liquid market."
This quote from the 2018 Sloan Conference1 illustrates a key problem with draft picks as a means of exchange: they are illiquid.
This interested me given in theory a draft asset can be valued anywhere from near nothing (e.g. a top-55 protected 2nd round swap) to highly valuable (e.g. several unprotected first round pick from a team projected to be one of the worst in the league), and almost everywhere in between.
This piece is an exploration of creative ways to structure deals involving draft picks to make them more liquid; that is, filling in the "everything in between" studio space a bit more. The inspiration for the title is the arbitrarily complex set of derivative financial assets that financial engineers have created, called Exotic Derivatives, to fuel the Wall Street casino. It is a work in progress.
The Constraints
According to the CBA Bible2, the following constraints (non-exhaustive, ignores the matching salary and player components) must be satisfied in any draft pick trades:
- "Seven Year Rule" - draft picks more than 7 years in the future can't be traded.
- No more than 55 picks in a single draft can be protected.
- "Stepien Rule" - A team may not trade away all first round draft picks in consecutive years. However, they may trade away their own (or another team's) so long as they are in possession of at least 1 unprotected draft pick in that window.
- Teams can add protections to picks it acquires only if they received the pick in an unprotected form.
- One-time options to defer the conveyance of a pick for 1 year can be added to unprotected picks.
These rule-based constraints along with several practical constraints surrounding team-building make draft pick trades that are both mutually palatable and allowable for all parties tough to come by. What follows is a description issues that get in the way of deal-making and and potential creative alternatives, from relatively tame to wacky. We will use the logic from Programmatic Draft Valuation to approximate the value of draft assets.
(As a caveat I'm not sure if all of these are all legal with certainty, just that if they were they would be interesting.)
Creative Pick Concepts
Specific Pick Protections on Swaps
The Stepien Rule applies to any chance that a team won't have a first-round picks in consecutive years. This means that the downside to constructs like multi-year pick protections is that they hamper the ability for a team to trade picks in any subsequent year surrounding the years to which the protections apply.
It is well-known that swaps are a way to get around the Stepien Rule issue. A lot of the trades involving multiple swaps are specifically designed to get around the Stepien Rule for teams that have traded out all their first round picks, for example Phoenix trading swaps for Beal after giving up most of their tradeable draft picks for KD. Even when it's not born out of necessity though, swaps can be a way to increase the liquidity of draft picks.
For example, consider the Kings draft asset that they sent Atlanta in the Kevin Huerter deal: protected 1-14 in 2024, 1-12 in 2025, 1-10 in 2026, and 2026 + 2027 2nds if not conveyed by then. Our basic model estimates that at the time of the trade, with the Kings coming off a season finishing 24th in the standings, using Pelton's 9-year surplus estimates, this asset is worth roughly 20.8 units (20.8% as valuable as the #1 overall pick). Here is the probability distribution of the various conveyances:
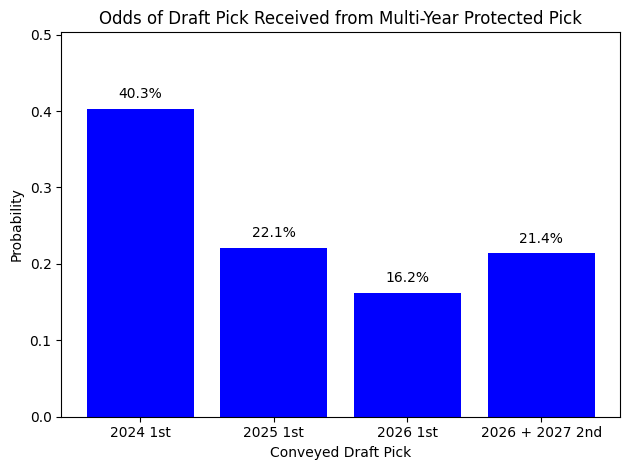
And what the distribution of picks this will end up being looks like:
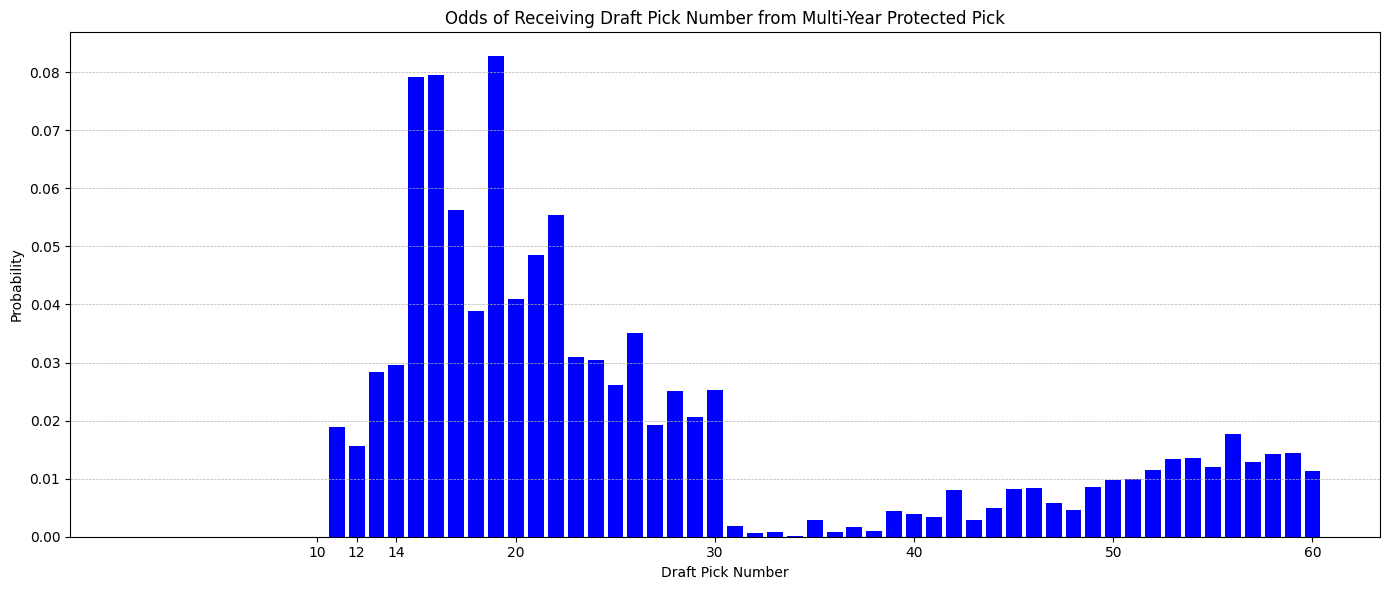
However, this trade effectively prevents the Kings from trading any first round pick from 2023 to 2027 to avoid breaking the Stepien Rule, even if it is unlikely to last till 2027.
Instead, we can replicate the exact same expected value payoff with a 2024 right to swap that is protected for picks 1 and 4 (but not 2 and 3) turning into the 2026 and 2027 2nds if not conveyed, which comes out to worth exactly 20.8 in utility as well while maintaining the flexibility to trade any first round picks in the 2023-2027 window.
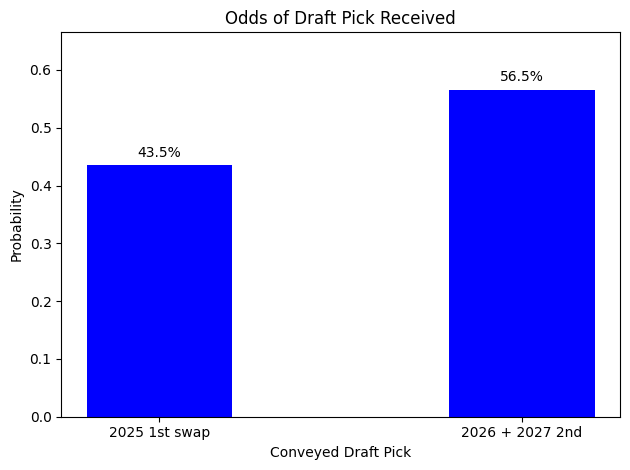
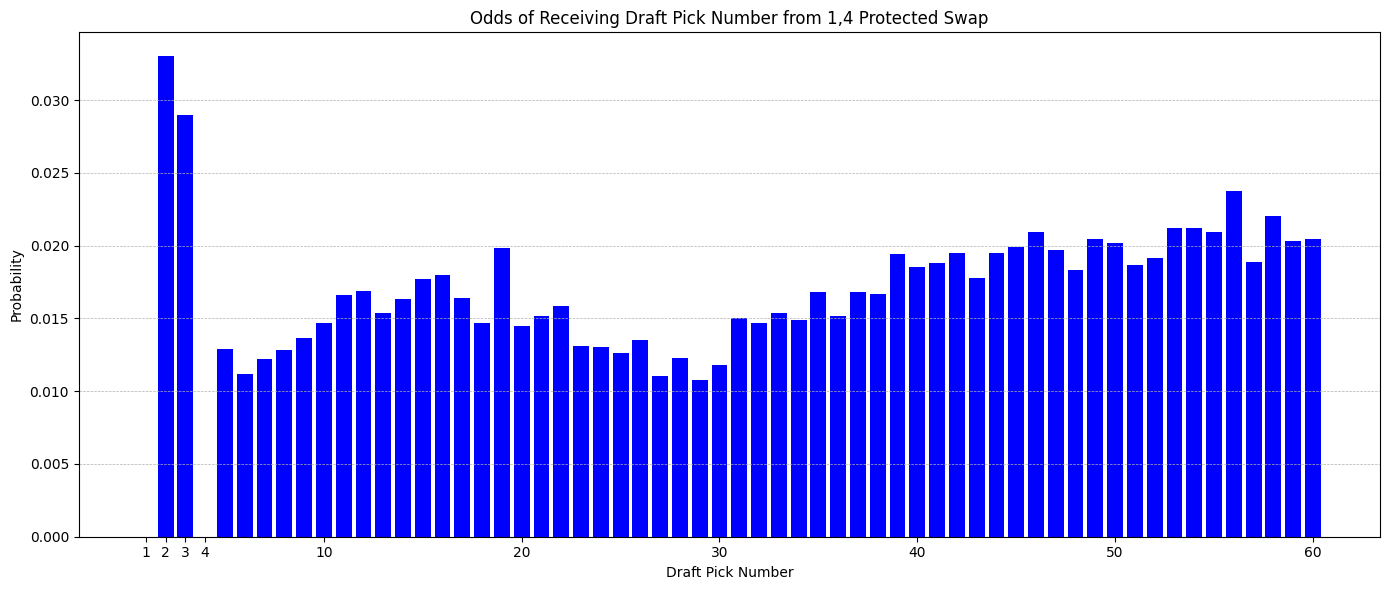
Note that odds of converting the 2nd or 3rd overall pick is elevated relative to the other draft picks, because if the Kings do land one of those picks they are almost certainly going to swap it with Atlanta, but a lot of the time end up just sending over a second round pick or a late first instead. This is a feature, not a bug.
There is nothing forcing us to protect within a continuous range: we can protect specific picks. In particular for picks 1-4, because every team in the lottery has a specified percentage chance of landing one of those picks, thinking carefully about which of them to protect can allow us to more accurately replicate the desired payoff.
Specific pick protections can also take advantage of a rare win-win scenario: a focused rebuilding team like OKC may have too many young prospects to roster, forcing them to make difficult roster crunch decisions and aggressively bundle picks to trade up in the draft, while a contending team trading them the pick likely doesn't want to tie up their draft pick flexibility for too many years into the future. Instead of receiving a multi-year protected pick, OKC can opt to receive the pick say if and only if it lands at pick number 2 or 3. This significantly reduces the probability they have to add another young prospect, but conditional on conveying, it is likely to be a very good one that they'd be more than happy to open up a roster spot for.
Further, we can use different draft pick values depending on the objective of the franchise - a team with a long time-horizon might opt for Pelton's 9-year surplus approach, a team that is more focused on the near-term might opt for a 3 or 4-year surplus approach, and a team that only values future championship odds might optimize for All-NBA probability.
Using Draft Protections Predictively
Standings and draft pick numbers by extension are fairly predictive one year out but not predictive more than a few years out4.

An aggressive team can use this predictive power, and lack thereof, to their advantage.
Suppose a team has agreed to send over an unprotected first round pick several years out. As a recipient team we want receive that pick in a year where the team is likely to be bad, but we have very little ability to predict which year that would be the case. If right now is 2023, we know very little about what the distribution of a team's 2026 pick will look like. But the 2026 pick tells us a lot about about what 2027 will look like.
A draft asset structured as follows could be interesting:
- 2026 1st: conveys if it's exactly pick number 15
- If it lands 1-14, turns into 2027 unprotected 1st
- If it lands 16-30, turns into 2030 unprotected 1st
The 2026 1st is essentially a dummy asset with almost no chance of conveying because it needs to be exactly pick 15. But what it does tell us is that we want next year's draft asset if it's a lottery pick, because that means the team is likely to be bad next year as well. If it's not a lottery pick, we want the pick 4 years out, because that means the team is likely to be good next year as well, while 4 years out we revert to base rates.
This is a creative (unsure if legal?) way to maximize the odds that the unprotected pick we receive comes at a time when the team is more likely to be bad, and hence land a high draft pick.
Protect Early, Swap Middle, Send Late (PSS)
One issue with draft swaps is they often involve a contending team giving a rebuilding team the right to swap, which either becomes non-exercisable or less valuable if both teams mean revert to similar standings. For example, Zach Kram3 found that only 3 of 31 times, a swap gave a team the equivalent of a top-20 pick or better in value delta:
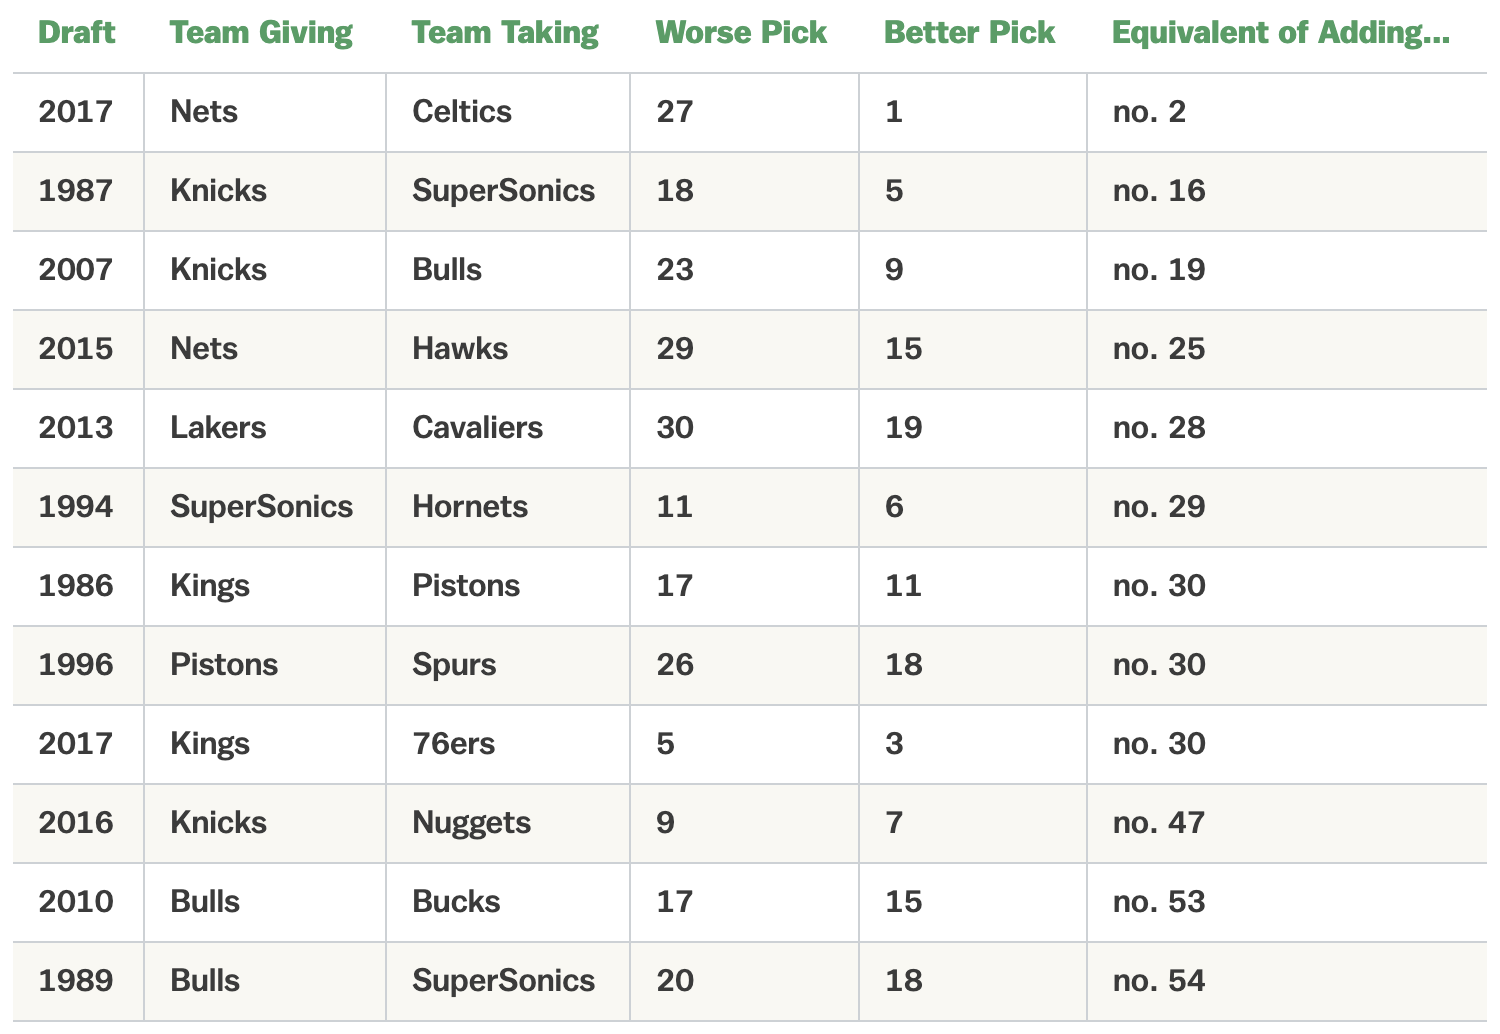
There are a few challenges to creating a mutually palatable swap deal:
- A team giving up a swap wants to be protected in the event that they receive one of the top picks.
- Swaps of mid to late draft picks have very little value.
- A recipient team probabilistically isn't going to be able to exercise a swap if they're bad.
One way to thread the needle here is the Protect Early, Swap Middle, Send Late (PSS) construction: protected 1-4, turns into a swap from 5-15, and is sent as a straight up pick if 15-30.
We can think of this as reverse protecting the delta of a swap. Even if the recipient team ends up being able to swap with a late pick, this swap will be worth very little, so receiving the pick outright ensures they're getting non-negligible value. Swaps become interesting if say a team can move up from the 20's to a pick in the 5-15 range. But protecting the 1-4 range ensures that the team giving up the swap is protected from the downside of the swap.
- https://www.youtube.com/watch?v=jL2ZSMQOOS4&t=431s↩
- http://www.cbafaq.com/salarycap.htm#Q89. Please let me know if any other constraints are missing; "Unlike most aspects of basketball operations, most specific trade rules are not found in the league’s collective bargaining agreement"3↩
- https://www.theringer.com/nba/2019/6/27/18760309/nba-title-windows↩
- https://www.theringer.com/nba/2022/10/12/23399637/nba-draft-swap-picks↩
Thoughts on Crashing
Introduction
There are 2 ways to win a basketball game: get more scoring attempts off ("possession") or score more points per scoring attempt ("efficiency"). As shooting efficiency becomes comparatively more of a solved problem in the league,1 I've become fascinated by the possession game, and its interaction with efficiency. This piece explores one aspect of the possession game: crashing the offensive glass.
Traditional wisdom is that on balance, crashing for offensive rebounds is net bad because of the costs it incurs on transition defense2, although this philosophy is evolving to some extent as well3. This is hard to prove with a high degree of confidence in either direction with publicly available data because on a play by play basis, we can only see the result of whether there was an offensive or defensive rebound, not whether there was a crash attempt (and from whom) itself.
At a higher level, it's hard to define what crashing for a rebound even means - is any movement towards the basket "crashing" on an individual level? What if you're already in the vicinity of the basket? How many people must crash to constitute a team "crash"? Moreover, even trying to use proxy variables like the result of a rebound attempt in order to prove causality is tough because of certain selection effects: teams who are bad at shooting tend to crash more, teams crash more when they're down, etc. To go from "teams who crash more are better/worse" to "crashing causes teams to be better/worse" requires proof of causality.
What I have more confidence in is that situationally crashing can be a good idea and we need to carefully consider the opportunity costs. This piece is a bit of a hodgepodge of hypotheses around crashing. The unifying theme, to the extent that there is one, is that optimizing crashing and the offensive rebound game requires navigating a series of tradeoffs, notably with first-shot offense and transition defense. There may be situations where the tradeoff can be avoided or even flipped.
(Simplified) Anatomy of a Crash
To begin, lets outline what a crash looks like along various decision points. Consider this play that develops into offensive rebound by Dorian Finney-Smith:
We can split a crash opportunity like this into at least 4 steps:
- Pre-Shot Positioning
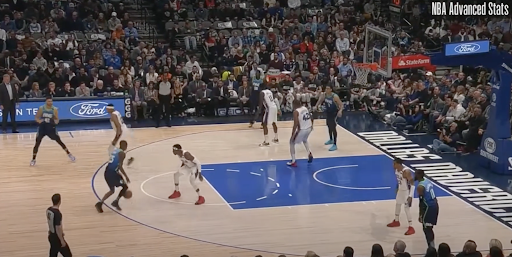
From left to right of the ball, Finney-Smith is in the weakside corner, Powell is in the dunker spot, Kleber is on the wing, and Hardaway Jr. is on the strongside corner. As we'll delve into, this has effects on all of first shot offense, crash probability, and the chance of securing a rebound.
- The Shot
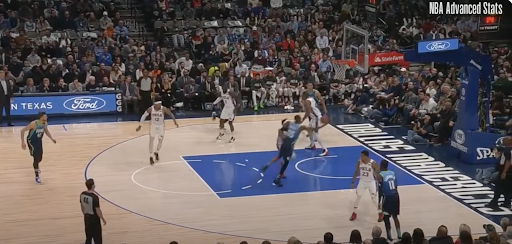
The shooter Wright attempts a driving layup in the paint in isolation against Richardson. Note that details of the shot such as degree of help drawn and location4 has a large impact on the potential rebound outcome.
- The Decision to Crash
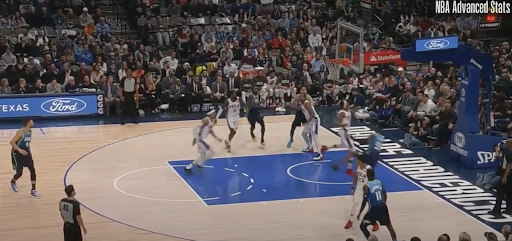
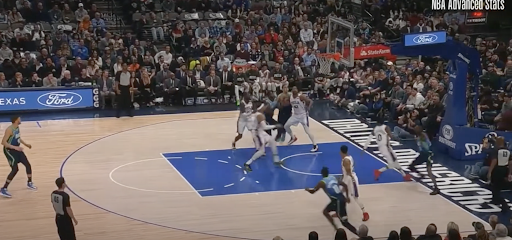
As the shot is going up, Finney-Smith and Powell crash to the basket, while Kleber and Hardaway Jr. (as clear from the bottom image) begin to retreat. Finney-Smith takes a "backdoor" crash path to the basket from the corner while Powell is more stationary because he's being boxed out by Horford.
- 4A. (Conditional on an Offensive Rebound) 2nd Chance Offense

Finney-Smith gets an immediate putback layup out off the offensive rebound. Note that these putback opportunities are often easier than the original shot attempt because the defense is often out of position on the ensuing rebound scram. If the second chance offense has to reset this edge is no longer as prominent, particularly with the shotclock reset now being 14 seconds instead of 24 seconds.
- 4B. (Conditional on a Defensive Rebound) Transition Defense
Because this ends up in a made second chance shot, transition defense is not a factor. However, if the shot had missed, the personnel as well as some of the strategic decisions made in steps 1-3 would have had a significant effect on the transition defense. For example, one could argue that Dallas' floor balance is off, with 4 players past the free throw line extended, allowing Philly the easy possibility of leaking out in transition conditional on securing the defneisve rebound. On the other hand, all 5 Philadelphia players have also committed to being inside of their own free throw line extended, with several attempting to provide defensive rebound support, meaning there's no one to outlet to.
Space and Crash
One of the key contributors to the interaction effects between offensive rebounding and shooting efficiency is pre-shot positioning ("Step 1"). Widely scheme and personnel dependent, but positioning forwards outside the 3-point line generally improves first-shot offense (by giving the initiator more space to operate) but generally decreases offensive rebounding chances (by increasing the distance from a potential offensive rebounder to the basket; as we'll discuss later on in this section though, spacing out the opposing best defensive rebounders may provide large advantages). In 2016, Zach Lowe5 noted:
The historic drop-off goes beyond transition paranoia. Teams are playing more small ball, and asking their power forwards to shoot 3s -- slotting good rebounders 25 feet from the rim. "You're just so far away," says Kris Humphries, who barely snags offensive boards now that the Wizards have turned him into a 3-point shooter. "It's hard to run all the way in, and then run back on defense." Kevin Love, Serge Ibaka, Scola and lots of other reinvented snipers could empathize.
In 2023, we can replace "power forwards" to "forwards and centers" and "25 feet" to "30 feet" and the quote would still be accurate: teams have gone from 4-out to 5-out offenses at a much higher rate and spotting up deep behind the 3-point line has become common.
Given the (warranted) focus on space in modern offenses, I believe players who can space and crash from the 3-point line on the same possession will become very valuable. Broadly speaking, there are 2 semi-overlapping categories of offensive rebound crashes:
- a player (often a big) is already near the basket and in position to get the rebound (call it "static crashes")
- a player (often a wing) crashes in from the perimeter, often the corner 3 or sometimes the wing 3, to collect the rebound ("dynamic crashes")
Those who can credibly spot up, thus not hurting first-shot spacing, and dynamically crash, thus improving the odds of a second chance, on the same possession will likely have outsized value compared to players who force a tradeoff between spacing and offensive rebounding. The Finney-Smith clip above is one such example, as well as several from Kawhi's insane 2019 postseason run. The corner may be more feasible to crash from given the shorter distance to the basket, but crashing from above the break is also possible for special athletes like Kawhi.
Even for players without the most credible 3-point shot, crashing from the perimeter may be a way to punish defenders that are completely sagging off. Consider this play from the end of the Knicks-Cavs 2023 Game 1 that nearly broke the New York sports bar I was watching the game in:
Note that Mobley's boxout on Randle comes late because he's not closely guarding Randle on the perimeter and instead choosing to hone in on Brunson and the ball. As a result, Randle is able to crash in from above the break and secure the game-winning offensive rebound.
Drive and Kick and Crash
Another situation to gain an offensive rebounding edge while maintaining spacing and avoiding transition defense leakage is having the initiator stay near the basket in rebounding position on kickouts. Consider this play from Lauri Markkanen:
Plays like this where the creator stays near the basket to offensive rebound after driving can be very valuable because at that point they don't have a clear boxout matchup especially if they've drawn help. For a bigger creator like Markannen this can be a deadly way to generate extra putback opportunities.
Further, Markannen isn't harming first-shot spacing because he's the ones using the space created and has already created a good look at 3, and as the initiator with forward momentum he likely wouldn't have been in position to retreat back on defense anyway.
This clip also illustrates the importance of spacing for rebounding purposes. Atlanta's best defensive rebounder in Clint Capela is dragged out to contest the 3-point shot from Olynyk, leaving Markkanen with a relatively uncontested look at a tip-in.
Game State
When a team is behind especially later in a game, crashing for offensive rebounds becomes more valuable because the opportunity cost of giving up transition defense is lower. This is because the team is in a position where they need to score more points and should be risk-seeking; in the limit at the very end of the game, if they score they have a chance to win the game, if they don't they had no chance to win anyways, so giving up a transition bucket doesn't change their win probability. In addition, the opposing team is less likely to push in transition because of clock management reasons so the tradeoff is even less dangerous.
This also holds for end of quarter situations. In situations where there's not enough time for the other team to get a bucket off, it's clear that crashing aggressively has no tradeoffs to transition defense. In situations where there is enough time for the other team to get a bucket off, the other team will likely want to take the last shot so will be less likely to push in transition anyways. If they do push in transition and score too quickly, your team now has the opportunity to get another shot off.
Another area that could require further exploration is crashing more in bonus situation. It is hard to track via public data but my intuition is that the increased chance of free throws from non-shooting fouls (for example when being grabbed to prevent an offensive rebound) adds a substantial amount of value to crashing when in the bonus.
Targeting
Attacking weak point of attack defenders is a widespread strategy in the league now, but attacking rebounding mismatches may be less prioritized despite trends in the league possibly making it more valuable.
The increase of spaced 5-out offenses makes relative rebounding ability (between an offensive player and his defender) comparatively more valuable than absolute rebounding ability. The reason is that if it's less likely that there's a primary rebounder camped out in the paint due to the effects of space, an offensive player may just need to beat his primary box-out to secure a rebound; this is the basis for the "dynamic crash" category of offensive rebounding discused earlier.
This is accentuated by the strategies of modern defenses. As defenses have gotten more switch-heavy, it's more likely that after a 2-man action, a smaller guard is the primary box-out defender on a big or a larger wing. This is a mismatch that can be exploited by the offense by having the big crash. By default, teams are also trying to hide their weakest defenders on players with less on-ball offensive ability. Due to selection effects, these players are often quite athletic, else they wouldn't have made it in the league without as much on-ball ability. A natural way to attack this mismatch that's situationally more effective than attacking them with the ball is to do so on the offensive glass.
Crashing the glass against teams and players who do not push in transition at a high rate may be a component of a targeting strategy. Certain initiators known to prefer half-court offense may be better targets for crashing than those who may punish a failed crash attempt with consistent push-ahead play. On the other end of the court, against players who do not crash at a high enough rate there is likely a strategic advantage to be had having their defenders leak out early in transition when the shot goes up.
Further Questions
Thanks for getting to the end of this brain dump. Some further questions I have include:
- Which players are generating large offensive rebounding value when they do crash but don't crash at a high rate? And vice versa?
- Is this due to coaching or is it due to a lack of motor or some other individual issue?
- Is positioning and decision-making over when to crash an individual skill or something comparatively more coachable?
- To be clear it is nowhere close to completely "solved." But if you look at simple heuristics like 3PA rate, the rate of increase is slowing down, and there seems to be a general understanding that 3's, rim shots, and free throws are the most efficient shots. Getting to those shots is a different question though.↩
- https://www.espn.com/nba/story/_/id/14505051/transition-defense-left-offensive-rebounds-cutting-room-floor↩
- https://www.thescore.com/nba/news/2536613↩
- https://squared2020.com/2019/11/18/offensive-crashing/↩
- https://www.espn.com/nba/story/_/id/14505051/transition-defense-left-offensive-rebounds-cutting-room-floor↩
Valuing NBA Draft Trade Assets Programmatically
When writing Exotic Picks, I wanted to be able to test the base rates of various draft pick trade concepts in code. The first task would be to figure out how to value and implement a draft trade asset programmatically. This post describes my approach and some of my learnings from this exercise.
Standing Trajectories
At its core, a draft asset trade is a bet on the future performance of a team, and by consequence where a draft pick potentially several years into the future will land. To make such a prediction requires a model of how a team's performance will change over time. In particular we need to know the distribution of a team's performance in future years, not just the average. Averages are misleading in a draft context where the distribution of player impact is highly skewed. For example, knowing that a team will average the 15th best record in the league could mean that they land the 15th every year or that half the time they land 1st and half the time they land 29th, the latter being far more valuable from a draft pick value perspective.
The simplest way to predict the distribution of how a team will perform in year t + 1 is to use their standing in year t. Under the umbrella of simplicity here we can use the most naive approach of all: assume the distribution of a team's standing in year t + 1 is equal to the empirical distribution of how all teams with the same standing in year t have historically performed. For instance, the empirical distributions for standings in year t + 1 of teams with standings 3 and 27 in year t over the last 184 years looks like:

This gives a decent starting point but it's fairly clearly that this doesn't reflect the true probability distribution of what the standings for year t+1 should look like. For starters, every standing is possible in year t+1, but the empirical distribution has a lot of 0 probability mass for certain standings. Further, small sample size gives couterintuitive implications here, for example it's pretty unlikely that the #3 team has a 5.5% chance of being the worst team in the league the following year but we only have 18 data points and it's happened once (shout-out 2019->2020 Warriors).
One way to smooth this probability distribution is to use the outcome of neighboring standings to inform the outcome of a particular standing. For example, it's pretty likely that the empirical distribution of standings for teams with standings 2 and 4 in year t will be pretty informative of how standing 3 will turn out, but less likely that standing 15 is informative. We incorporate a decay factor of 0.75 to model this likelihood: that is, we weight the empirical distribution of standings for teams with standings 2 and 4 in year t by 0.7 and the empirical distribution of standings for teams with standings 1 and 5 in year t by 0.7^2 and so on. This gives us a smoothed probability distribution of standings for year t+1 that looks like:

We can apply a similar process to projecting multiple years out, smoothing out the empirical distribution of standings multiple years out.

Note that this distribution is less skewed than the next year distribution - intuitively a team is more likely to perform similarly next year than 2 years out.
From a distribution of standings we can then directly calculate the odds of landing each particular draft pick from the NBA lottery gods.6
Of note, the distributions are still randomly spiky at certain draft standings. In retrospect I probably should've used a bucketing approach8 then sampled from each bucket but this is a good enough approximation for now.
Draft Pick Value
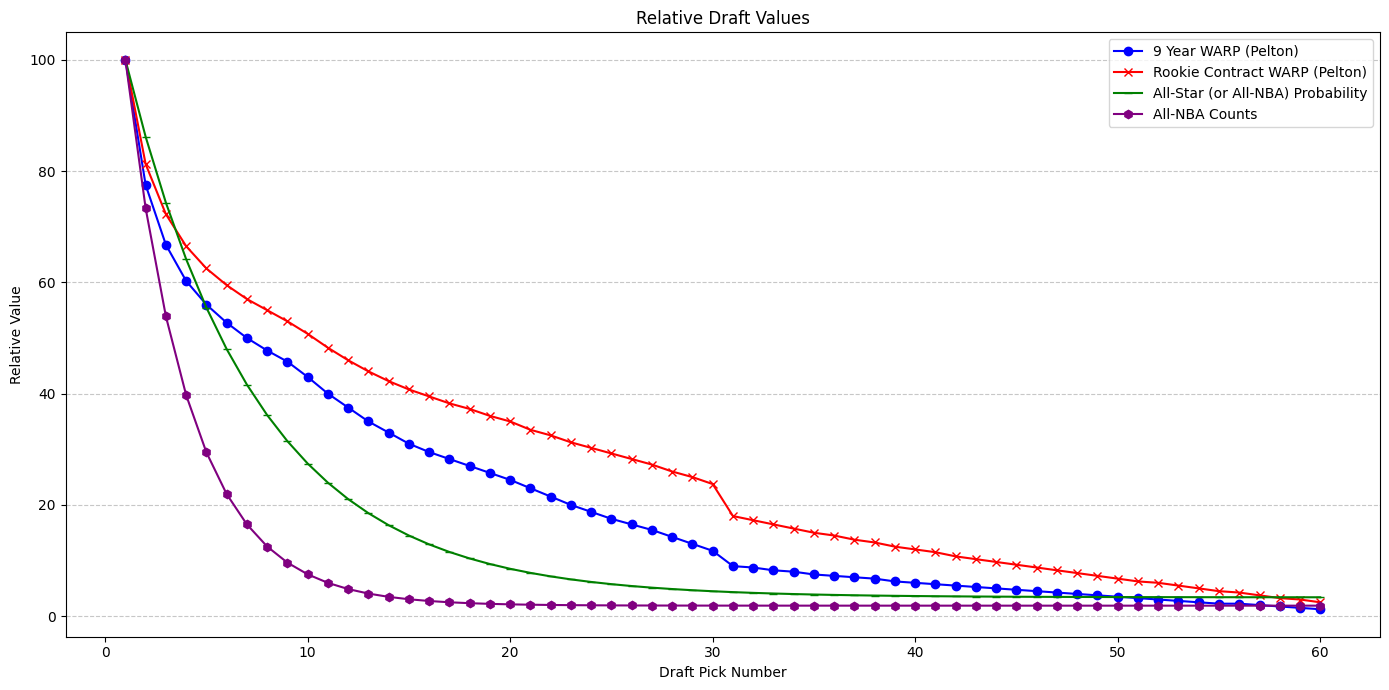
There have been many attempts to estimate the relative value of a draft pick at particular slots, so this won't be the focus of this piece. In fact, differences in opinion and valuation based on what stage a team is in are a big part of the reason trades involving draft picks exist. Instead, I use the following rough estimates:
- Surplus value across rookie contract (Pelton) - how much a player outperforms their contract during the rookie contract
- Surplus value across first 9 years (Pelton) - how much a player outperforms their contract during the first 9 years of their career
- Star Probability - whether a player makes at least 1 All-Star or All-NBA team in his career
- All-NBA Counts - how many times a player makes an All-NBA team
Note that the more star and upside focused we get, the more skewed the distribution of player value becomes. For example, the surplus value of the #1 pick across the rookie contract is roughly 2x the surplus value of the #2 pick, but the all-NBA equity of the #1 pick is roughly 10x that of the #10 pick.
Defining a Draft Pick Asset Class
What makes this a bit tricky to implement this programmatically is that a draft asset is different from a single draft pick in that an asset can be a function over several picks, and can turn into other assets conditional on conveyance or the lack thereof. For example, a pick can be top-3 protected in 2022, top-1 protected in 2023, and unprotected in 2024. Similarly, an asset can be the most favorable of 2 picks in a given year (via a swap).
We define a draft pick as:
@dataclass
class DraftPick:
    team: str # Team abbreviation
    year: int # The year the draft pick would be be conveyed
    round_number: int # 1 or 2 for first or second round
    protection_numbers: list # List of pick numbers that are protected
    is_deferrable: bool # Whether a pick is deferrable or not
To turn this into an asset:
- The list of picks that could be in play
- A function that specifies which of these picks gets conveyed. For instance,
MOST_FAVORABLEwould return the pick with the highest number (as would be the case in the right to swap), andALLwould return all of the picks.
class AggregatorFunction(Enum):
    MOST_FAVORABLE = "MOST_FAVORABLE"
    LEAST_FAVORABLE = "LEAST_FAVORABLE"
    ALL = "ALL"

# one single draft pick bundle is a set of draft picks for a given year
class DraftPickBundle:
    def __init__(
        self,
        draft_picks: List[DraftPick],
        draft_pick_aggregator_function: AggregatorFunction,
        recipient_team: str=None,
    ):
        self.year = min([draft_pick.year for draft_pick in draft_picks])
        self.draft_picks = draft_picks
        self.draft_pick_aggregator_function = draft_pick_aggregator_function
        self.recipient_team = recipient_team # necessary for Swaps
An asset can then be represented as an ordered list of DraftPickBundle, where if the first bundle is not conveyed, then the next bundle is considered, and so on.
There are still key edge cases of draft assets that this cannot express, for example "first conveyable" picks where a team can convey a pick in the first year they're allowed to under the Stepien rules, but we'll ignore these for now.
Valuing a Draft Asset
Based on the components we've defined above we can now value a draft asset based on the current standings.
- Based on how many years out the earliest conveyable
DraftPickBundleis, we can calculate the probability distribution of what the standings of said team will be at that point in time. From this, we can simulate what the standings will be at that point in time and get a probability distribution of the draft picks by extension. - We can calculate the odds that the pick lands outside of protections (and hence is conveyed), and if so what the expected value of that pick will be.
- If the pick lands inside of protections, we can recursively repeat the process for the next
DraftPickBundlein the asset - that is, simulating the standings for the next year of the draft pick bundle based on the most recently updated standings.
Case Studies
For the following case studies, 100 is the value of the 1st overall pick in a given year. Unless otherwise specified, the value framework we use is Pelton's surplus value of the pick across the first 9 years of the player's career.
The Value of Protection
Here we chart out the value of a 3 categories of picks (lottery protected, top 4 protected, unprotected) in the years 2024, 2025, and 2026 for a fringe contender that has the 8th best record in 2023.
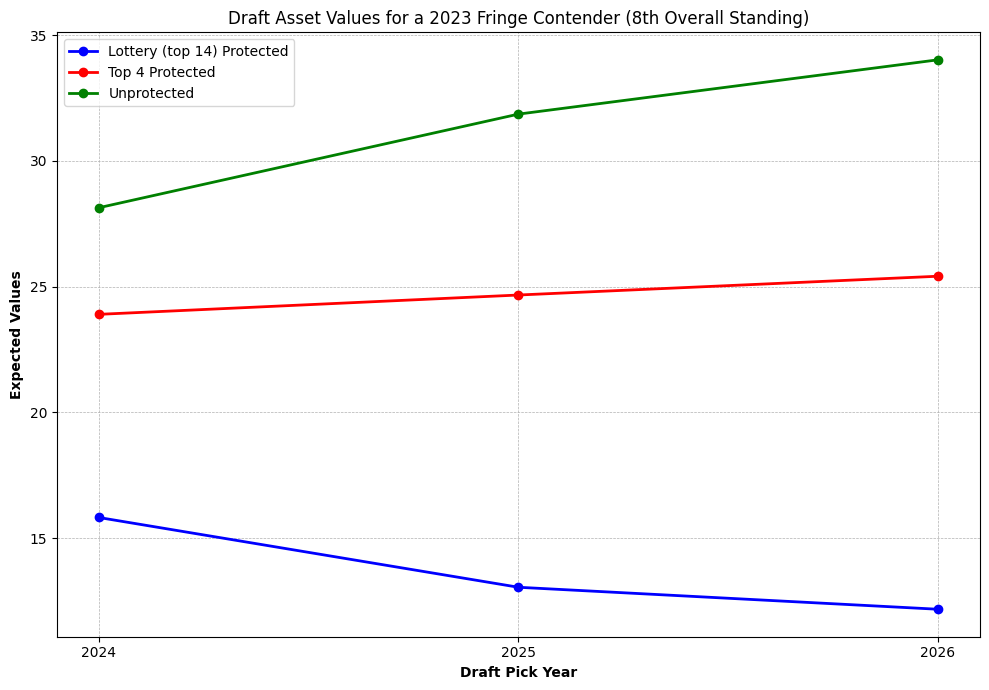
We see that protection can dramatically decrease the value of a pick, especially in the case of lottery protection. As expected the value of an unprotected pick goes up the farther out it is for a fringe contender. Interestingly, the value of the pick goes down if it's lottery protected. This is because the odds of the pick being conveyed are lower over time as a current contender is less likely to remain a contender over time, increasing the likelihood that the pick falls within protection and is thus not conveyed.
Reverse Protection
Consider the famous trade that brought Kyle Lowry to the Raptors and a reverse-protected pick back to Houston in 2012 (and eventually got flipped for James Harden). The details of the pick are described as follows7:
The pick was protected if it fell between Nos. 15 and 30 in perpetuity
The pick was protected between No. 1 and No. 3 in 2013; No. 1 and No. 2 in 2014 and 2015 and, if it still had not been conveyed, at No. 1 in 2016 and 2017."
This is referred to as a "reverse-protected" pick because it is lottery guaranteed as opposed to protected. Both the upside and the downside of the pick are protected. To see how this affects the value of the pick, we can compare how the asset would have A) as is, B) without the top pick protections, and C) without the reverse protections.
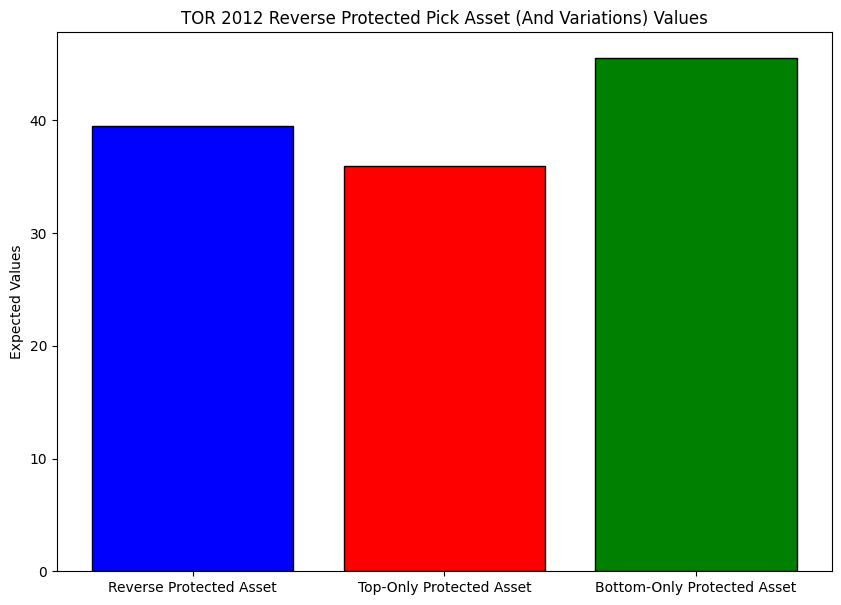
As by design, the reverse protection makes the pick more valuable than if only the top of the draft was protected. In fact, the impact of the reverse protection by this model is likely understated based on the impact that Lowry could have been expected to have on the Raptors' performance: the Raptors went from 23 wins in 2011-2012 to 34 wins in 2012-2013. This amplifies the importance of the reverse protection given that the better the team the more likely the pick would have fallen later in the following year.
Conclusions and Future Directions
This initial attempt to value draft assets based only on a team's standings at the time of the trade, using smoothed historical trajectories based on how other teams have performed in such a situation and a predefined draft value chart, is inadequate when considering the complexities of team situations. However, I believe that it is useful as a starting point to measure the base rate of where team's end up potentially several years later, and how to think about the value of protection accordingly.
Human or automated changes to the model can be made according to a team's situation. For example, a team in a clear contending window may only value the surplus of the first 2-3 years of draft picks, while a team in a clear rebuilding window may only value the all-star or all-NBA upside of a pick. Some additional areas I'd like to explore:
- How do we improve our estimates of standing trajectories - can we incorporate age of best players, years remaining on contract of best players, or other team characteristics? Can we do this mid-season as well?
- Can we model the impact that draft asset trades have on team behavior, and as a result how it alters the distribution of future standings? For example a team that has given up an unprotected pick in a given year is highly disincentivized to perform near the bottom of standings (even if it doesn't improve the value of their assets to win a few more games). A team that owns all its unprotected picks and has an infusion of young talent is likely to distribute minutes to its young players even at the cost of wins. This is similar to the "Moral Hazard" concept in economics where for example, somebody with insurance may take more risky actions than somebody without.
- How does correlation affect the value of bundles of draft picks? For example, a set of picks and swaps from the same team across a short time window are likely to be highly correlated, while a set of picks from different teams across a long time window are likely to be less correlated. Do we prefer high correlation because conditional on a team being bad at that point in time, the receiving team would be getting a ton of high value picks in succession (à la Nets-Celtics 2013 Trade), or do we want a more "diversified" portfolio of picks?
- What are some ways we can replicate the payoff of draft asset trades without hampering flexibility? See Exotic Picks for a glimpse into some ideas :)
- 2005-2022. 2005 is the year we start from because that's the first year that there's 30 teams in the league↩
- Roughly estimated through cross-validation. This is performed by splitting the 18 years into N=5 folds, training on N-1 folds and maximizing log likelihood across the remaining fold. The decay factor that minimizes the mean squared error of the predictions is
0.7or0.8depending on the run,0.7was chosen because intuitively 2 picks away is weighted half as much as the current pick.↩ - https://www.tankathon.com/pick_odds↩
- For example as in here: https://www.theringer.com/nba/2019/6/27/18760309/nba-title-windows↩
- https://theathletic.com/1341618/2019/11/25/how-the-kyle-lowry-trade-forever-changed-the-toronto-raptors-houston-rockets-and-nba-trades/?source=twittered↩
Long Out of Bounds (LOB)
I believe that intentionally aiming to get the ball long out of bounds ("LOB") near the opposing corners in soccer is underutilized. I highlight a few reasons why below.
Offense
Given the starting point of:
- Having the ball close to the opposing team's goal is good.
- Having (or worse, losing) the ball in your own defensive third is bad.
- Throw-in's, especially near one's own goal, have a low rate of retention (~40%) and don't go very far1.
A logical conclusion is that forcing an opposing throw-in near their own goal (by launching out of bounds there) is likely a positive expected value strategy relative to attempting to progress it from near your own goal.
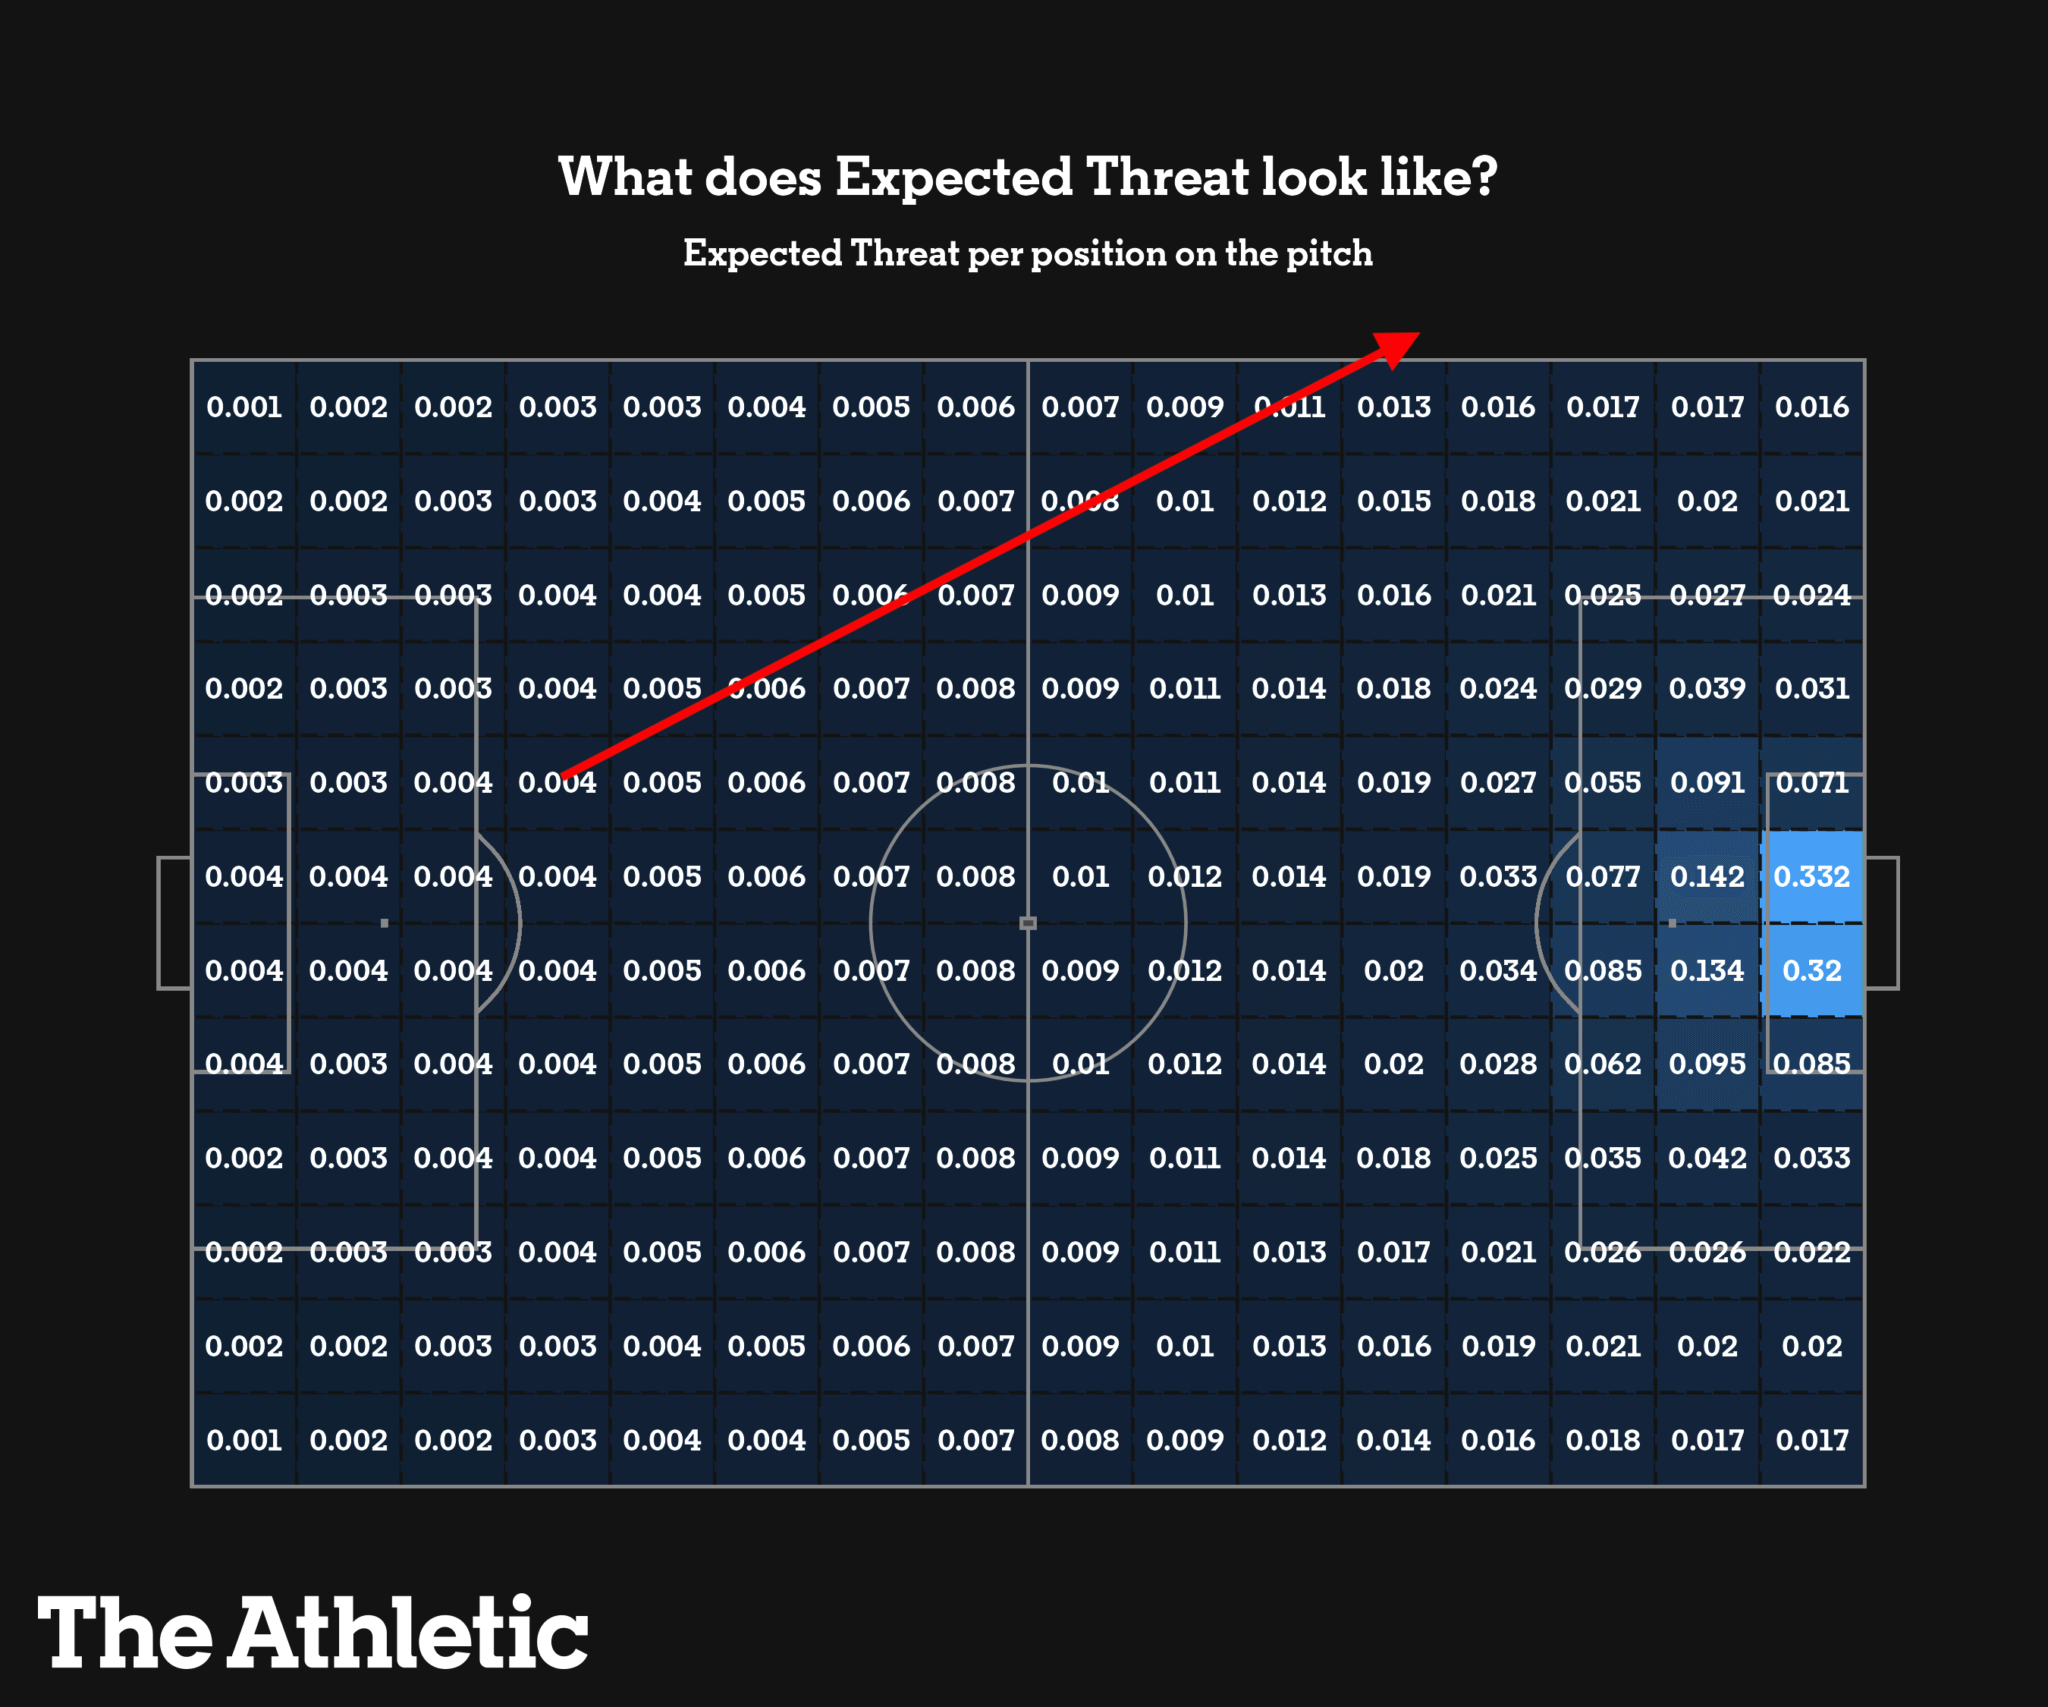
To give a rough estimate of how large the edge from this strategy could be, check out this xT2 (interpreted as the "percentage chance of scoring from the possession when the ball is in that position") plot from the Athletic, with the LOB pass drawn on:
When only considering the offensive value from this strategy:
- Starting from your own defensive third is worth ~0.2% to 0.5% in xT, or goal probability. Let's assume it's worth +0.4%.
- An opposing throw-in from the boxes near their own corner has a roughly 40% chance of possession retention. That is, 60% of the time it results in losing possession.
- Recovery of possession in that area is worth roughly 1.3% to 2.0% in xT. Conservatively, let's say it's worth 1.3%.
From 2 and 3 the odds of converting a goal from a successful LOB is worth around: 60% * 1.3% = 0.78%. This rudimentary calculation suggests that we are nearly doubling (from 0.4% to 0.78%) the odds of scoring a goal relative to normal run of play from the defensive third.
My confidence intervals around these estimates are extremely wide because the xT square-based approach only accounts for the average case EV of locations rather than situationally off a throw-in or a launch, and there is large uncertainty over where the ball would actually end up in play after a throw-in. Further, most throw-ins don't result from this LOB context, so the throw-in retention numbers might be off as well. However, I believe it's directionally correct that the EV of this strategy is likely quite positive.
Defense
This undersells the additional defensive value we get from this strategy. Losing possession near ones own goal-scoring half is catastrophic: it takes a ~0.4% goal scoring opportunity and converts it to at least a ~3% opportunity for the other team (likely much worse because the defense is less settled than normal run of play). This is the foundation behind why high-pressing has become much more frequent amongst teams capable of executing it.
This strategy instead risks losing the ball in the least dangerous area of the pitch, in a situation where the opposing team is only likely to retain immediate possession ~40% of the time.
Comparison vs. Route-1 Launches
The concepts here aren't novel. Long ball route one soccer3 has been discussed for decades, and more recently utilized by certain under-resourced teams.4 The strategy of launching the ball and pressing out of that has affectionately referred to as "launch and squish."5 There has been much written about how long kicks like these, for example in the context of long goal kicks, might be suboptimal6. However, the improvements of this more specific subset of the long-ball strategy may include:
- LOBs as opposed to in-play long balls offer the unique edge of low throw-in retention rates.
- LOBs give more time for your players to set up pressure compared to in-play long balls. Throw-ins generally take 7-15 seconds after the ball goes out of touch1 (though it is worth considering if a response to this strategy would be quick throw-ins).
- Even if the opponent retains possession from a throw-in, them doing so along the wings offers even less value than if they recovered the ball more centrally.
- In the limit of launch and squish's evolution, the other team could just launch it back. Throw-ins have a much shorter range of motion than regular passes, making this counter harder and conditional on successfully receiving the initial throw-in.
Not to mention, the LOB strategy is not mutually exclusive with regular short passes and in-play long balls. If the LOB strategy is successful, it may be worth mixing in in-play long balls with hold up players, and shorter passes, to keep the defense strategically honest.
Other Situations
Kicking it out of bounds to the LOB area may be strategic outside of the defensive third.
For example, if you are in the attacking third and a less technically proficient player receives an imperfect pass, the probability of a turnover leading to an opposing counter-attack may be sufficiently high; it may be worth kicking it out of bounds to instead force a throw-in that has a high probability of being regained.
Similarly, if a player is trapped in the opposing corner, one of the most likely outcomes is a goal kick, which has much higher completion odds than a throw-in given the increase in control and range the keeper has over the ball with his foot. Instead, it may be worth tapping the ball out of bounds and trying to regain the ball from there.
Depending on team composition, this strategy can be even more effective (or much worse) than in the average case. A team battling relegation has very little shot of progressing the ball normally from their goal to the opposing one through a Man City or Liverpool press (and probably is more likely to give up the ball in a dangerous position), but may have a shot of regaining possession from a throw-in, where the role of on-ball skill level is comparatively diminished. Why not try?
Counterguments
- The effect size is overstated because there's a decent chance you launch it either not out bounds or through the end line for a goal kick
- True, I believe with training if it's a larger component of a strategy, players would be capable of successfully executing this pass at a relatively high rate. This remains to be seen.
- Most teams that can successfully execute a high press also are possession teams e.g. the Barca and Man City's of the world. High press is tiring but you rest when you have the ball.
- Ideally, possession would be re-established after the LOB, just higher up the pitch. However the fatigue aspect is valid concern and perhaps means that it should be more selectively used rather than on every single possession.
- I also wonder how much of the high press sides being possession teams is an artifact of the fact that the best and most physically fit players are also technically proficient, or rather the combination of both of those factors compose the best sides in the world like Man City and Barca. There is some precedent of teams that truly commit to pressing even without organized possession, such as Eibar7.
- The numbers for recovery from throw in are likely inflated due to not having enough time to get your players in position.
- If LOBs were included as part of an overall strategy, you'd have numbers stationed up higher to begin with, so players wouldn't have to run all the way from their goal to the opposing one to get in position. However, this perhaps points to the advantage of less extreme longball out of bounds kicks, for example from midfield instead.
What else am I missing?
- https://www.americansocceranalysis.com/home/2018/11/27/game-of-throw-ins ↩
- Originally created by Karun Singh, uses a Markov Chain approach to quantify the value of each area of the pitch. It does not consider the sequence of play, for example whether a team is on a counter-attack, it's from a set piece, whether there's space behind the defense, etc. but is a useful rough heuristic for how valuable each spot on the pitch is. ↩
- https://www.phrases.org.uk/meanings/route-one.html↩
- https://spacespacespaceletter.com/barnsley-is-doing-moneyball-right-and-its-ruining-soccer/↩
- https://www.espn.co.uk/football/story/_/id/37614448/why-bayern-liverpool-top-clubs-never-stop-playing-back-even-goes-horribly-wrong↩
- https://www.americansocceranalysis.com/home/2016/12/7/attention-goalkeepers-stop-kicking-those-long-balls↩
- https://statsbomb.com/news/statsbomb-data-case-studies-passing-height-and-passing-footedness/↩
Marginal vs. Average Efficiency
Much of the sports analytics movement has centered around arguments like:
- A is more effective B on average by a certain metric.
- Thus, we should be doing more of A and less of B.
A, B can be passing and running, 3's and 2's, targeting your WR1 vs. WR2, fastball vs. other pitches etc. This has generally been my mental model too and directionally I agree with most of these takes. However, after reading a paper by Skinner and Goldman (2015) recently I was reminded that 1 alone is insufficient to prove 2 because it conflates marginal and average efficiency - what we care about most is whether an incremental rate of increase in A is worth more than an incremental rate of increase in B (marginal efficiency) rather than whether across all instances of A and B, A is worth more than B on average (average efficiency).
Consider a modified version of the toy example Skinner provides. Let p be the fraction of attempted shots that are 3's and all other 1 - p shots attempted are 2's. Let's further assume that each 3pt shot attempted is worth 2 - p on average and the points per 2pt shot attempted is a stable 1.0. That is, if you rarely if ever attempt 3's you will score close to 2 - 0 = 2 points per 3 (intuitively, you're only occasionally taking the most wide open 3's from the very best shooter so you're hitting around 66% of them.) and if you're attempting a 3 on every possession you will score close to 2 - 1 = 1 point per 3 (intuitively, the defense has entirely sold out to the 3-point line so you're taking a lot of contested 3's at a rate of around 33%). The expected value of this strategy is:
P(3 pt) * EV[3 pt] + P(2 pt) * EV[2 pt] = p * (2 - p) + (1 - p) * 1.0
Notably, there is a diminishing marginal return to attempting 3's, but at no point is an average 3 less efficient than an average 2. Yet, the optimal solution1 is when p = 0.5 for an EV of 1.25, so in this toy example we should be taking exactly half our shots from 3 and half from 2. Counterintuitively, at this point in time an average 3 is worth 1.5 points, so still worth much more than a 2-point shot worth 1.0 points. The mental model set up at the beginning would suggest we should still be shooting way more 3's. However, if we increased our 3pt attempt rate to say 75%, the expected value of this strategy would be around 1.19, markedly less than a 50% 3pt attempt rate. The solution occurs precisely when the marginal efficiency of a 3pt attempt is equal to the marginal efficiency of a 2pt attempt.2
Phrased differently, to answer the question of whether we should increase our rate of A, we should focus more on the extra instances of A/B we'd be adding/removing and the effect on the rest of our strategy, rather than the average outcome of how we're currently using each. An argument like "when isolating from the top of the key, a player can replace some of his pull-up 2's with stepback 3's without sacrificing spacing or altering the defensive context" is more persuasive than "3's are worth more than 2's on average so let's take more 3's." Context matters.
In practice, this doesn't always make an enormous difference to the average efficiency argument for 2 reasons:
- The difference between A and B for the biggest inefficiencies is large enough that the distinction between marginal and average efficiency is more of a rounding error.
- Defenses, and more generally responses to changes in strategy, take longer to react to changes in strategy than offenses take to change strategy, so performing A at a higher rate does not decrease A's success enough to justify a large marginal decay.
However, as league contexts become more efficient and defensive strategies catch up with offensive ones, this may change substantially. At worst, this is a reminder to couch arguments about strategic changes in terms of incremental value add as opposed to generic averages we've observed.
- The expected value of this strategy is:
P(3pt) (EV per 3pt) + P(2pt) * (EV per 2pt) = p * (2 - p) + (1 - p) * 1. 0.5 was found by taking the derivative of this function and setting it to 0↩ - When the derivative of
p * EV[2 pt]equals the derivative of(1 - p) * EV[3 pt]. This is equivalent to marginal efficiency because it measures the probability normalized change in EV from a marginal change in p.↩